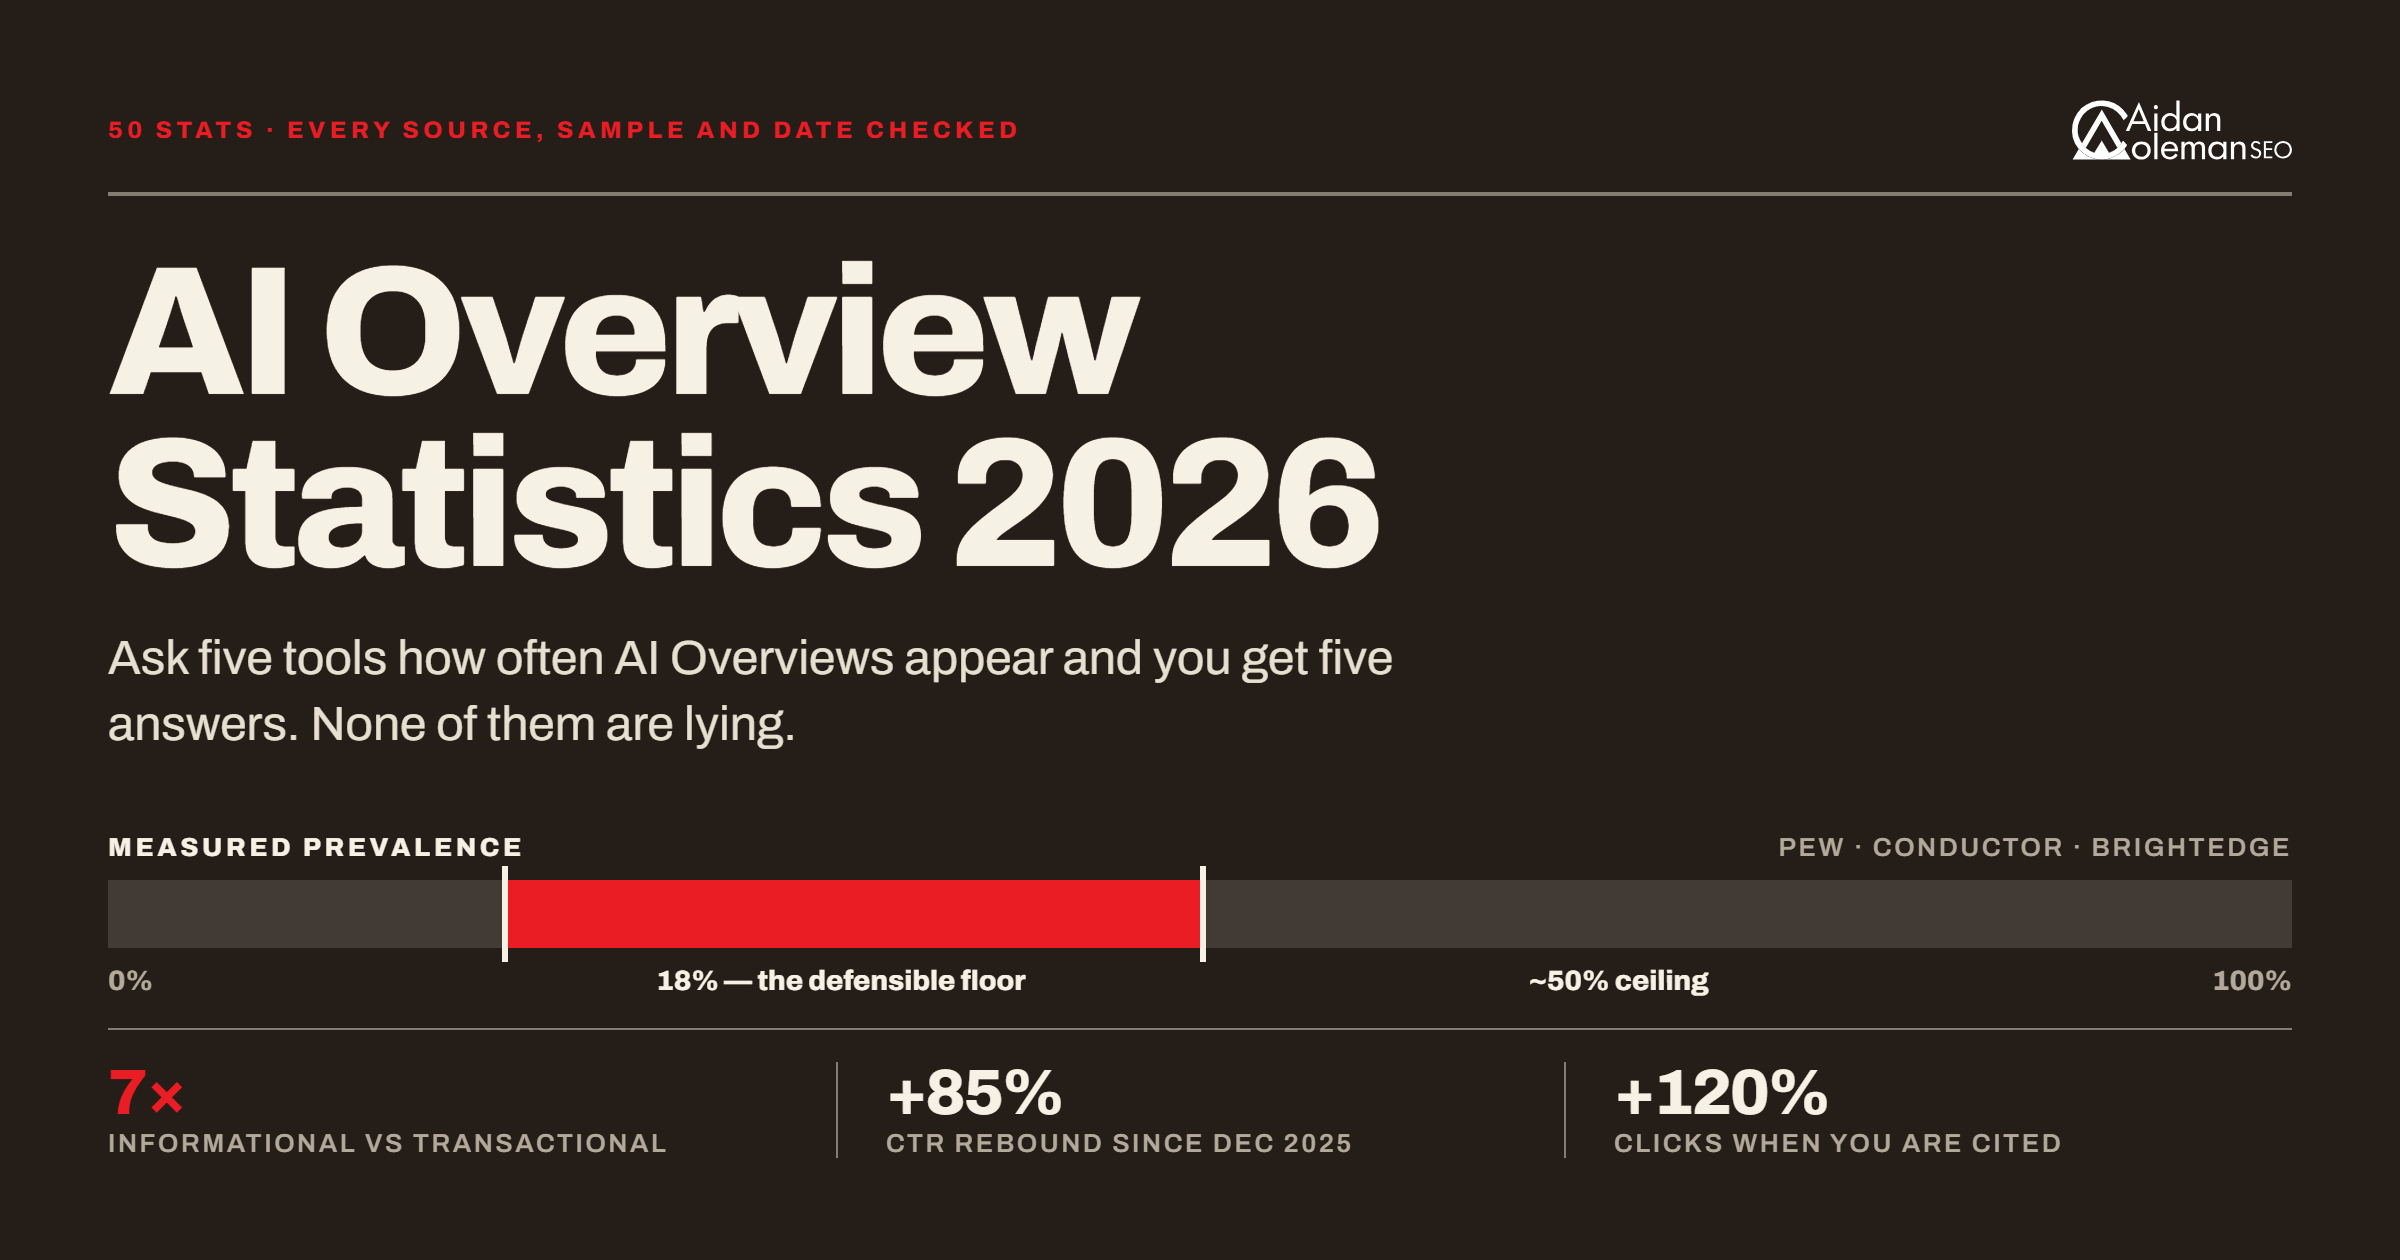
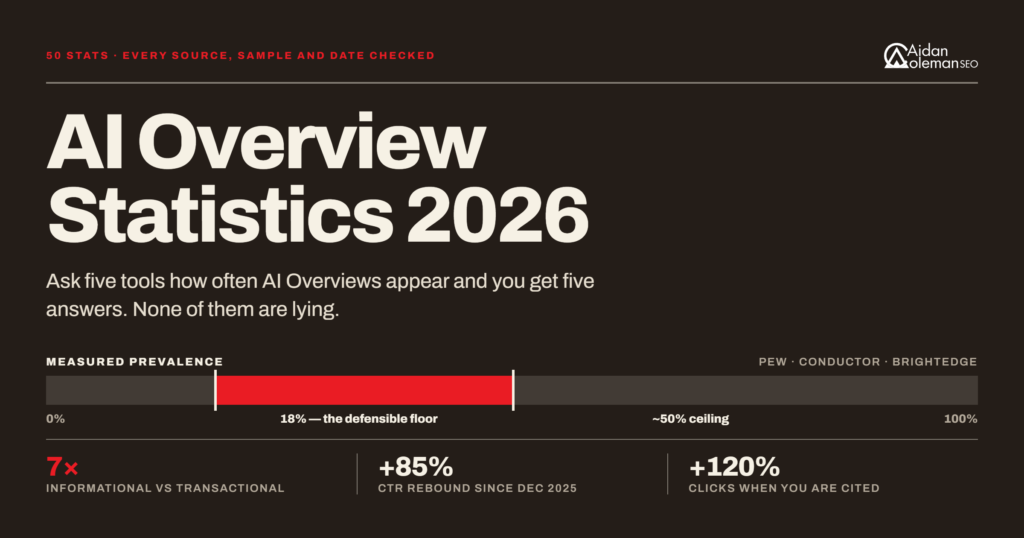
Ask five tools how often AI Overviews appear in Google and you will get five different answers, ranging from 18% to nearly 50%.
None of them are lying. They are counting different things, and almost nobody explains that.
So here are 50 AI Overview statistics with the source, the sample size and the date attached to each one, the Australian numbers that almost every article on this topic skips, and a practical walkthrough of how to actually see this stuff in your own Search Console rather than reading about it. For a more indepth look at how AI search is shifting as a whole check out our AI SEO Statistics article.
Key Takeaways
- Prevalence sits somewhere between 20% and 50%, depending entirely on which keywords you track. Roughly half of all searches still show no AI Overview at all.
- Informational queries are 7x more exposed than transactional ones. Comparison searches trigger an AI Overview 95.4% of the time. Transactional searches, around 5%.
- The click damage is real but it stopped getting worse. Click-through rate hit a floor in December 2025 and rebounded 85% in the two months after.
- Being cited is worth 120% more clicks than not being cited, though still 38% fewer than if no AI Overview had appeared at all.
- Search Console does not give you an AI Overview filter. It folds the data into “Web”, and the new AI reports show impressions rather than clicks.
AI Overviews, AI Mode and Gemini Are Three Different Things
Worth clearing this up first, because the stats below mean nothing if you mix them up.
AI Overviews are the summary block at the top of an ordinary Google results page. You did not ask for it. It appeared.
AI Mode is a separate tab. You choose it, and you get a conversational answer with no traditional results underneath.
Gemini is Google’s standalone assistant app, a different product again with its own model.
Google’s own documentation confirms both AI Overviews and AI Mode use a query fan-out technique, issuing multiple related searches across subtopics before building a response. It also states plainly that the two features use different models, so the links they show will vary.
That last line matters more than it looks. Checking one tells you nothing about the other.
How Often Do AI Overviews Actually Appear?
This is the most-asked question and the most badly answered. Here is every credible measurement in one place.
| Source | Prevalence | Sample and method | Date |
| Pew Research Center | 18% | 68,879 searches, real browsing behaviour | March 2025 |
| Semrush (Datos) | 13.14% | Clickstream panel | March 2025 |
| Semrush (keyword set) | 24.61% peak, then 15.69% | 10M+ terms | Jul to Nov 2025 |
| Conductor | 25.11% | 21.9M queries | Q1 2026 |
| BrightEdge | ~48% | 9 commercial verticals | Feb 2026 |
| Google (via Marketech APAC) | “roughly 50%” | First-party disclosure | Feb 2026 |
- Only 18% of searches produced an AI summary when Pew followed 68,879 real searches from 900 US adults in March 2025. This is the only figure here based on watching what people actually saw rather than querying a keyword list.
- Conductor put it at 25.11% in Q1 2026, across 21.9 million Google searches, up from 13.14% in March 2025.
- Semrush watched prevalence peak at 24.61% in July 2025, then fall to 15.69% by November across more than 10 million terms, after Google pulled back.
- BrightEdge measured around 48% in early 2026, a 58% rise year on year. Their keyword set covers nine commercial verticals, which is precisely why their number runs double everyone else’s.
- Google itself has been quoted at “roughly 50%” of US queries. Take that as a first-party claim rather than an independent measurement.
- The honest answer is 20% to 50%. If someone quotes you a single precise figure, they are quoting their own keyword list. Your exposure depends on what your customers actually type.
Which Searches Trigger an AI Overview
This is where the data gets genuinely useful, because it tells you which of your pages are at risk and which are not.
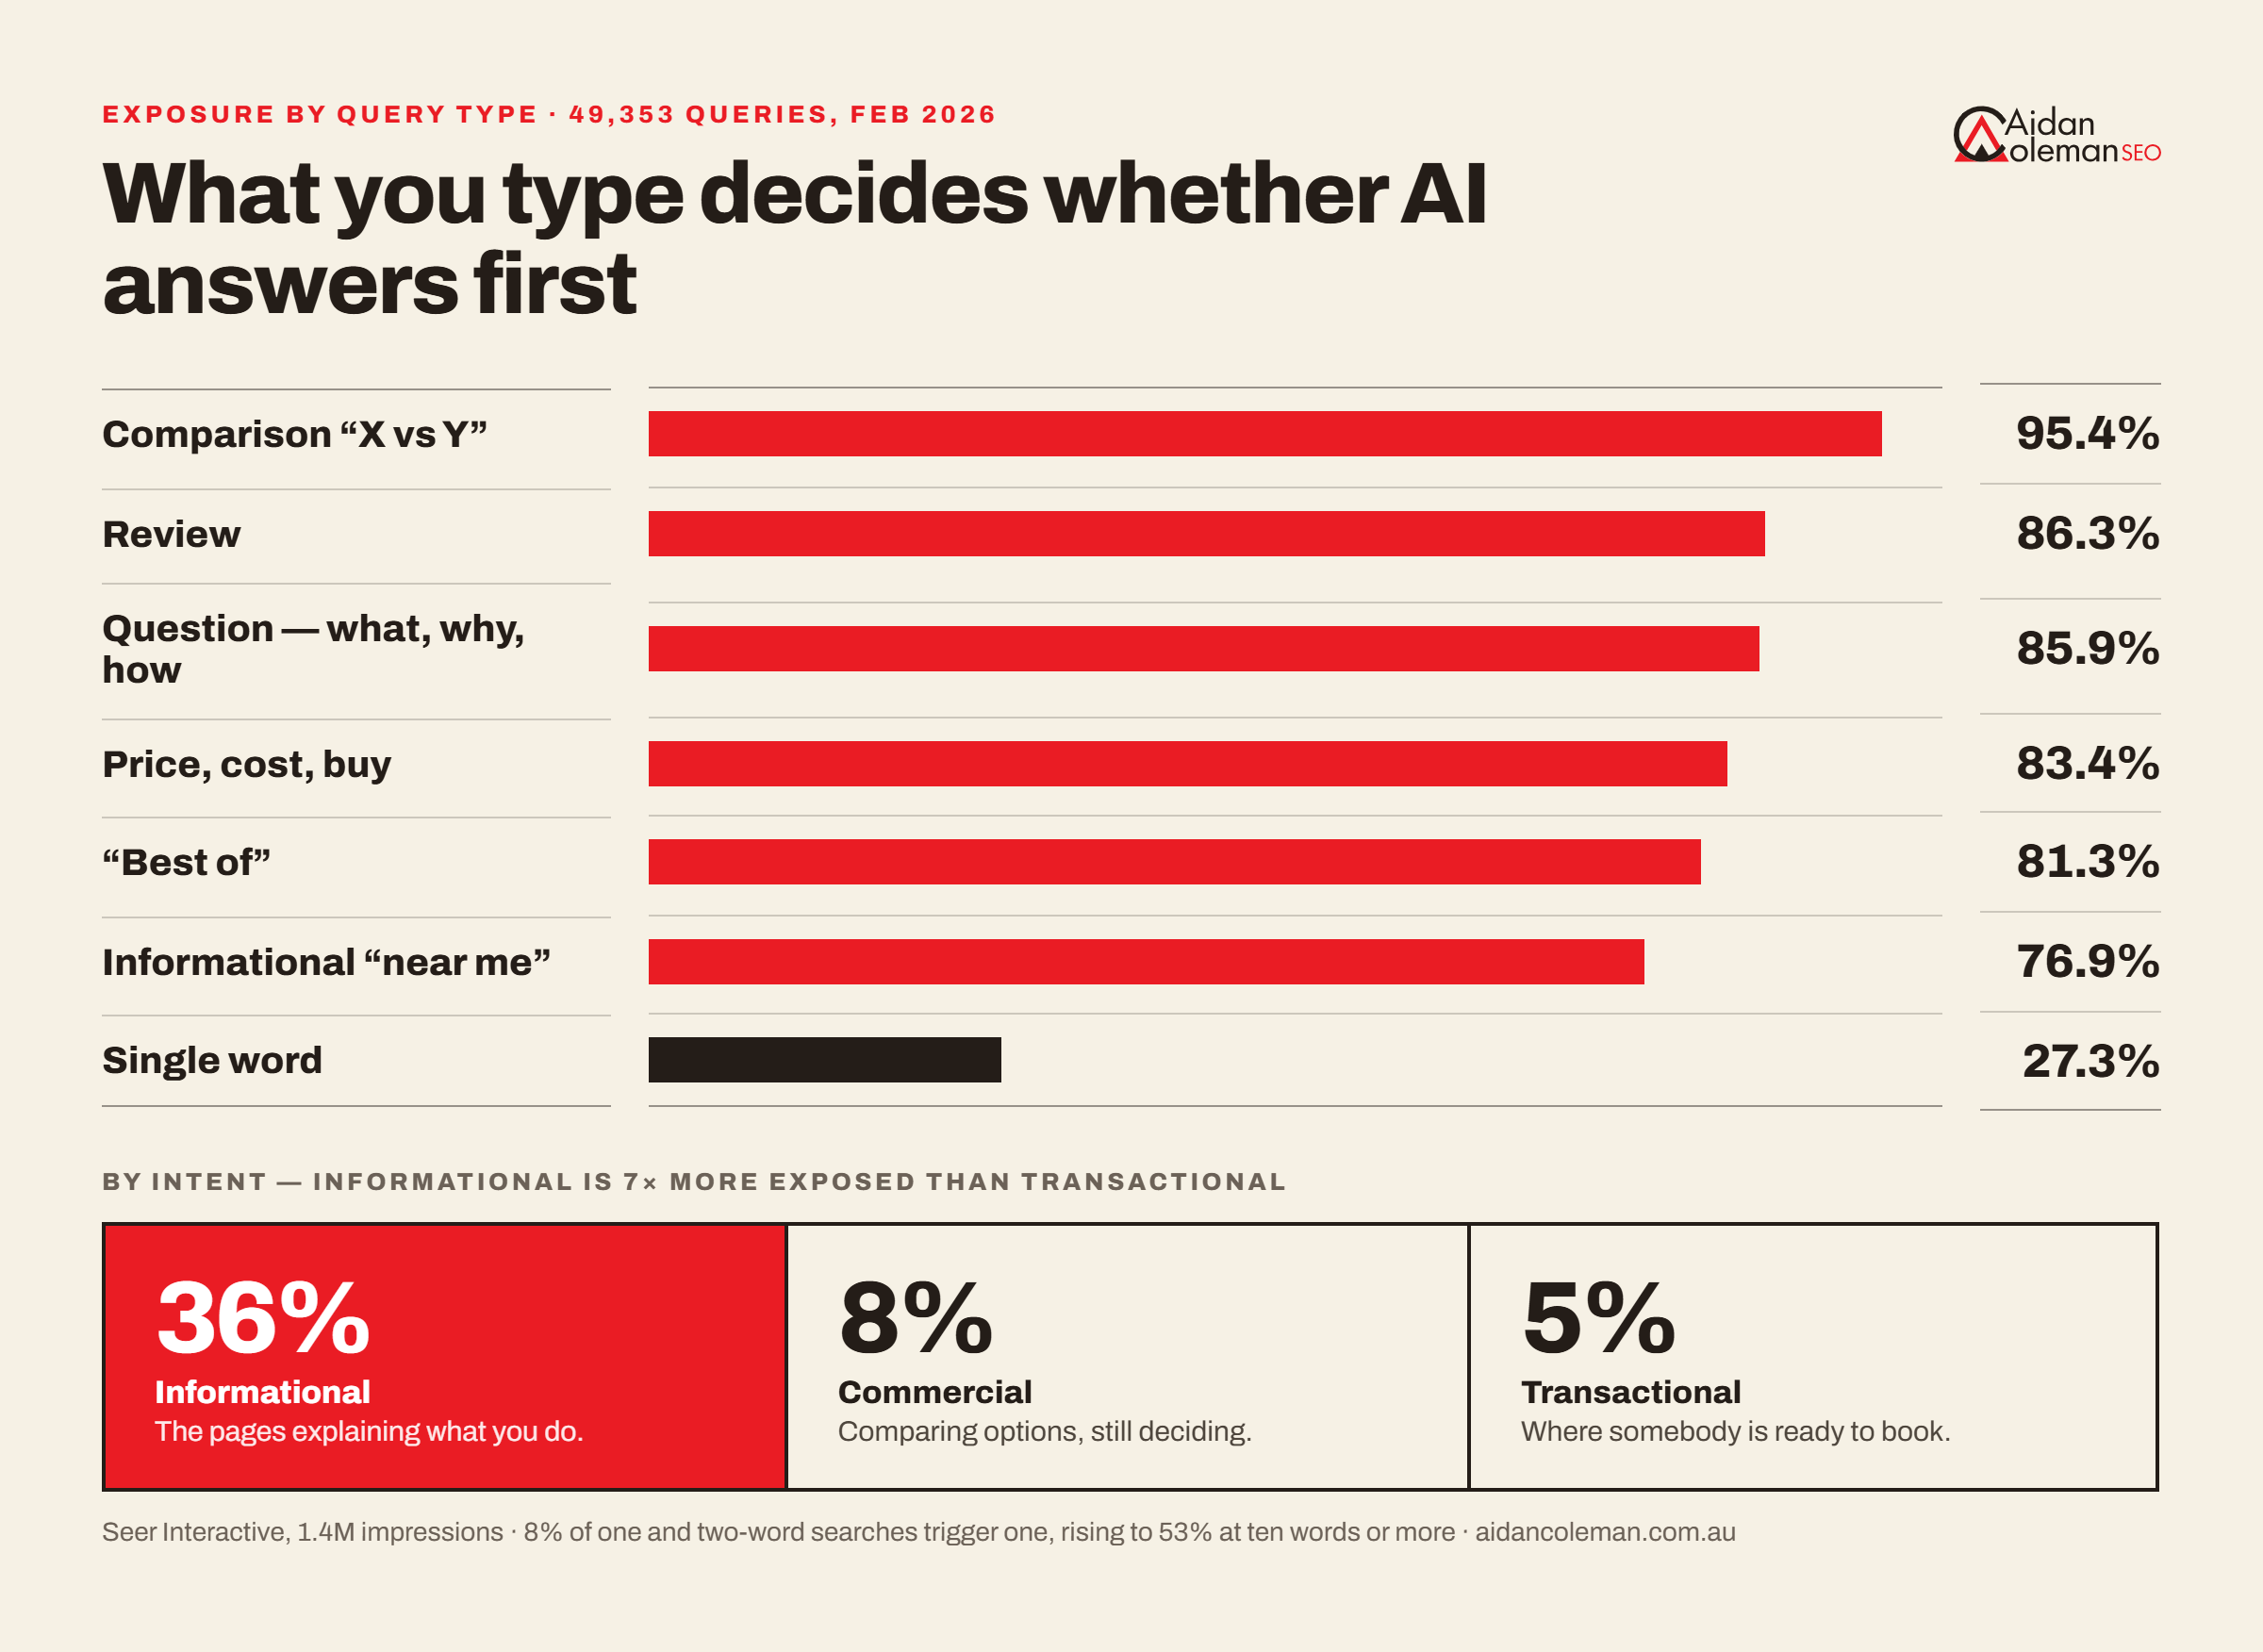
- Comparison queries trigger an AI Overview 95.4% of the time. Anything shaped like “X vs Y” is almost guaranteed to get one, based on a cohort of 49,353 queries measured in February 2026.
- Review queries: 86.3%.
- Question queries (what, why, how): 85.9%, across 1.4 million impressions.
- Price, cost and buy queries: 83.4%.
- “Best of” queries: 81.3%.
- Informational “near me” queries: 76.9%.
- Single-word queries: 27.3%. Short and vague gets you a normal results page.
- By intent, the split is stark: informational 36%, commercial 8%, transactional 5%. Informational searches are seven times more exposed than transactional ones.
- Just 8% of one and two-word searches produced a summary, rising to 53% for searches of 10 or more words. Pew found the same length effect from the behavioural side.
The practical read for a service business: the pages explaining what you do are exposed. The pages where somebody is ready to book are, for now, mostly not.
AI Overview Prevalence by Industry
- Healthcare sits at 88%, the most exposed vertical BrightEdge tracks, up from 72% a year earlier.
- Education jumped from 18% to 83% in twelve months, a 361% increase and the single biggest vertical shift on record.
- B2B technology went from 36% to 82%.
- Restaurants went from 10% to 78%.
- Insurance sits around 63%.
- E-commerce, real estate and shopping remain under 4% on some keyword sets. Google is visibly protecting the SERPs where it makes advertising money.
Find your industry in that list before you panic or relax.
What AI Overviews Do to Your Clicks
- Position-one click-through rate fell 34.5% when an AI Overview appeared. Ahrefs checked it against 300,000 keywords using real Search Console data, comparing March 2024 with March 2025.
- They re-ran it and found 58%. Comparing December 2023 with December 2025, position-one CTR fell from 0.073 to 0.016.
- Organic click-through rate on AI Overview queries fell 61%, from 1.76% to 0.61%. Seer followed 3,119 queries across 42 organisations and 25.1 million impressions between June 2024 and September 2025.
- Paid click-through rate on the same queries fell further, down 68%, from 19.7% to 6.34%.
- Then it stopped getting worse. The April 2026 update, covering 53 brands, 5.47 million queries and 2.43 billion impressions, found click-through rate hitting a floor of 1.3% in December 2025 and rebounding 85% to 2.4% by February 2026.
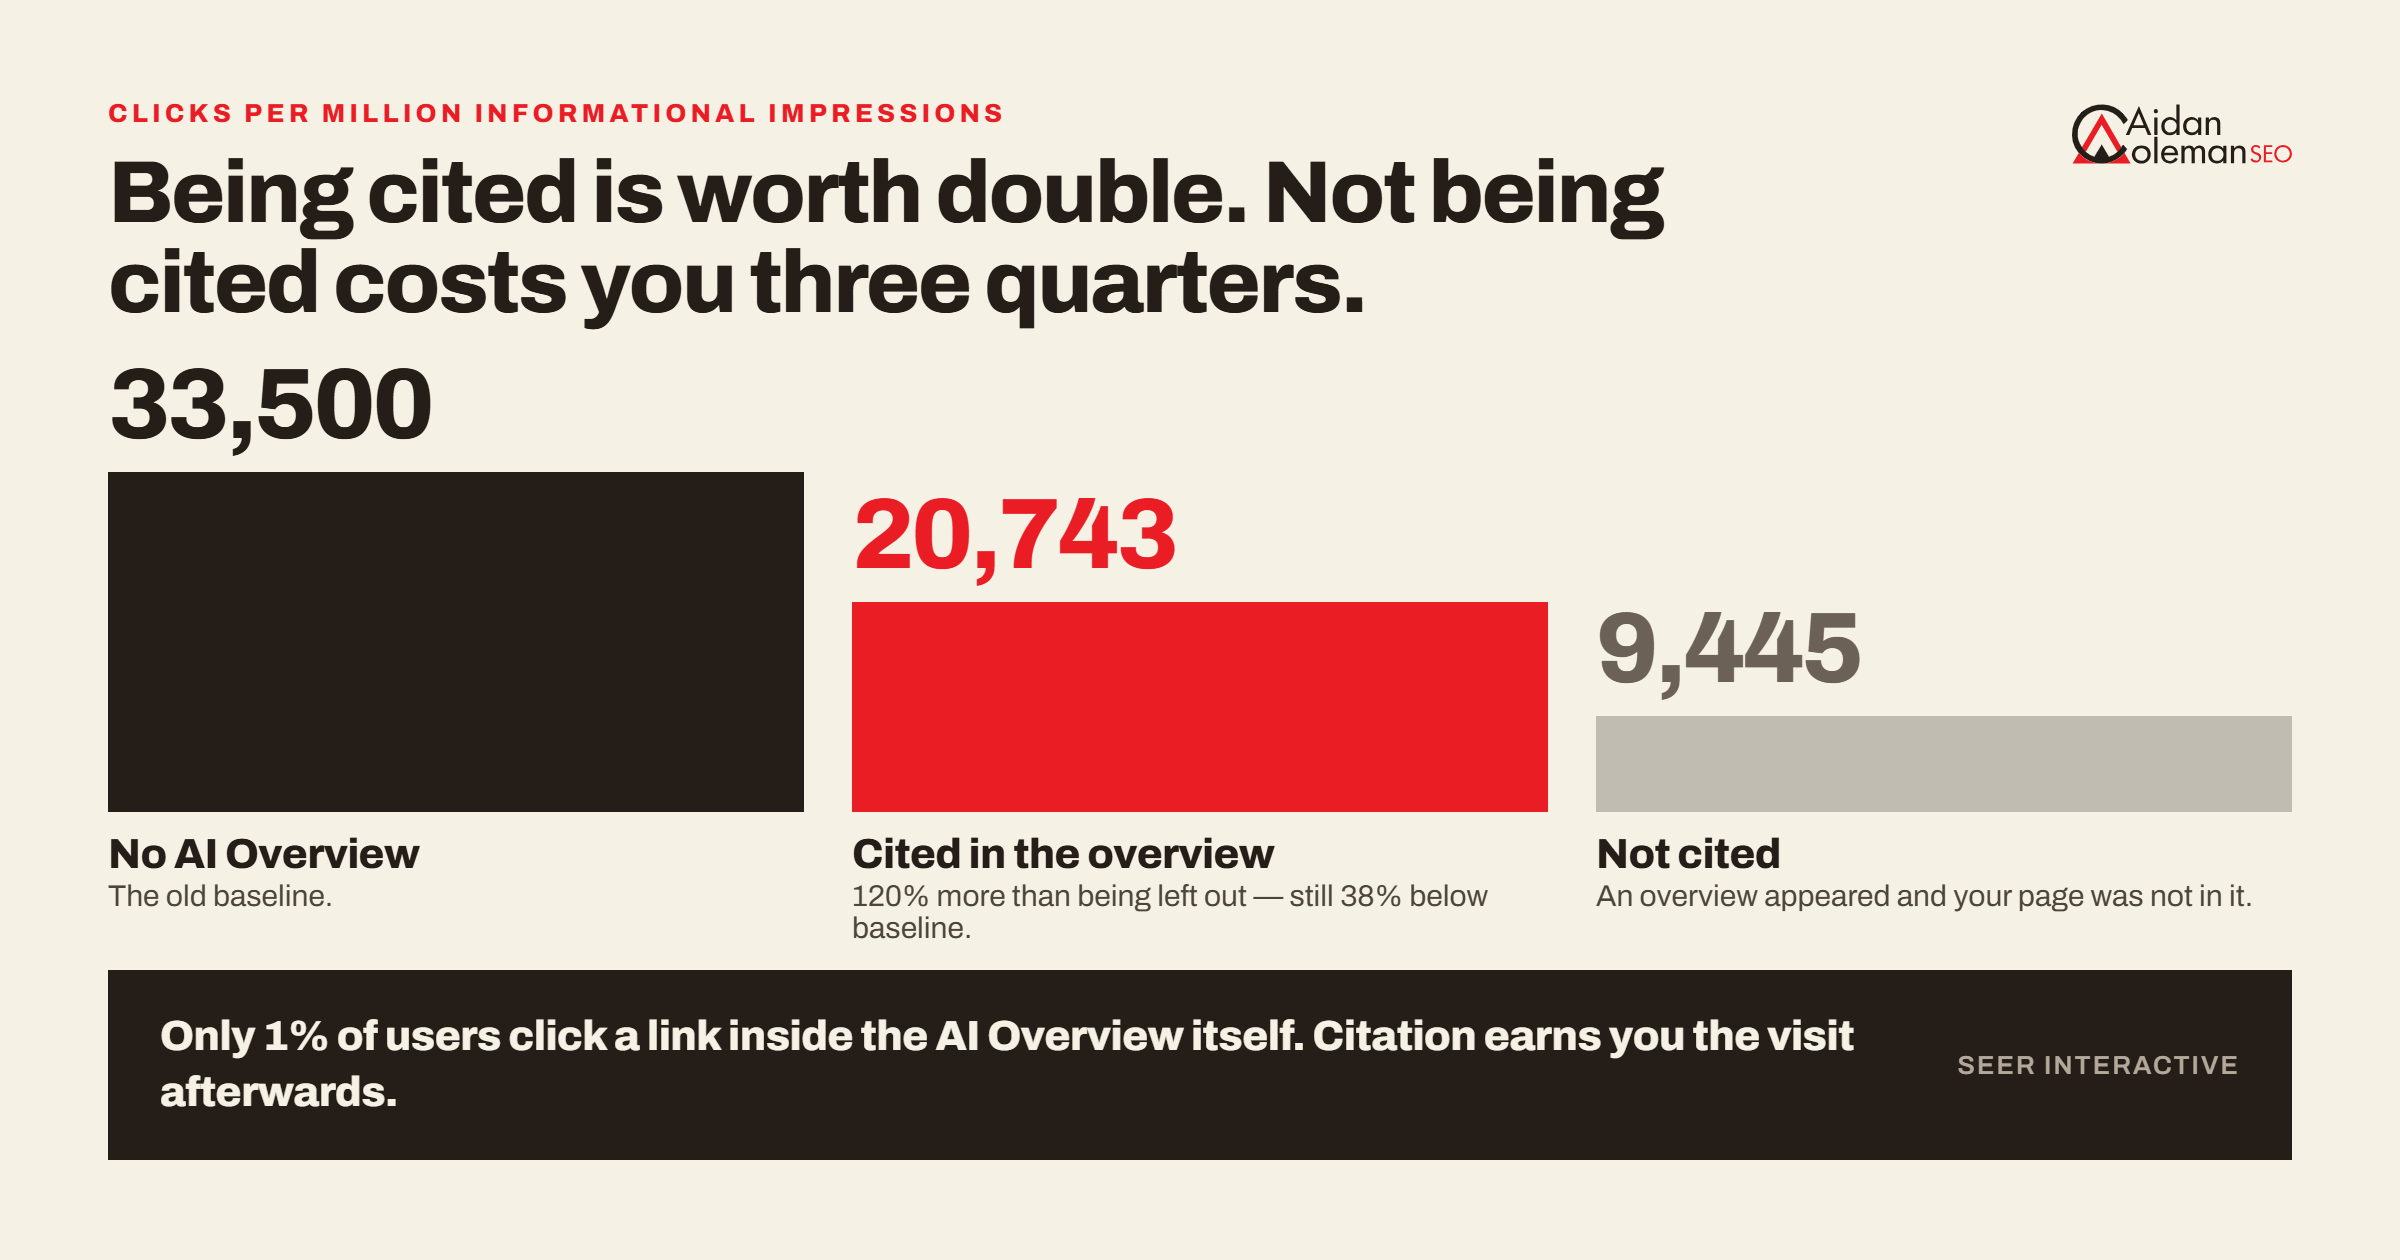
- Being cited delivers 120% more organic clicks per impression than not being cited. It still underperforms a page with no AI Overview at all by 38%.
- The per-million breakdown is the clearest way to see it. For every million informational impressions: around 33,500 clicks if no AI Overview appears, 20,743 if one appears and you are cited, 9,445 if one appears and you are not.
- People clicked a traditional result in 8% of searches with an AI summary, against 15% without. Pew’s number came from watching what people actually did rather than reading aggregate data. Google publicly disputed the methodology.
- Only 1% of users clicked a link inside the AI Overview itself.
- People ended their browsing session entirely 26% of the time after seeing a summary, against 16% without one.
- Amsive found a much milder 15.49% average decline across 700,000 keywords, and branded queries actually gained 18.68%. Stack an AI Overview on top of a featured snippet though and the drop hits 37.04%.
- In German results, position-one CTR fell from 27% to 11%, a 59% collapse across more than 100 million keywords.
- 68.01% of US Google searches ended without a click in early 2026. Working from Similarweb’s clickstream panel, SparkToro found only 276 of every 1,000 searches now reach the open web, down from 374 two years earlier.
Why the CTR studies disagree
The spread runs from 15.49% to 58%, which looks like chaos until you check what each one measured.
Ahrefs isolated informational queries, where AI Overviews appear on more than 99% of results. Amsive averaged across everything including branded searches, where an AI Overview sometimes helps. Pew measured human behaviour rather than aggregate Search Console data. Seer tracked one cohort month after month, which is why it caught a rebound the one-off studies could not.
They are answering different questions. The direction is unanimous.
What Actually Gets Cited
- 88% of AI summaries cited three or more sources, and only 1% cited a single source. The median summary ran 67 words, with a range from 7 to 369.
- 76.1% of AI Overview citations rank in the top 10 for the query, on Ahrefs’ analysis of 1.9 million citations. Another 9.5% rank between 11 and 100, and 14.4% do not rank in the top 100 at all.
- But 67.82% of citations do not rank in the top 10 for the main query or any of its fan-outs, on Surfer’s analysis of 173,902 URLs across 10,000 keywords in November 2025. Narrow it to just the top three visible citations and that falls to 45.86%.
- Pages ranking for fan-out queries were 49% more likely to be cited than pages ranking only for the main query.
- Moz ran 40,000 queries through AI Mode and found 88% of citations did not appear in the organic results for the same query.
- BrightEdge tracked top-10 citation overlap growing from 32.3% to 54.5% over 16 months, but found only around 16.7% of citations come from the top 10. Overlap swings hard by industry: roughly 75% in healthcare, around 11% in finance.
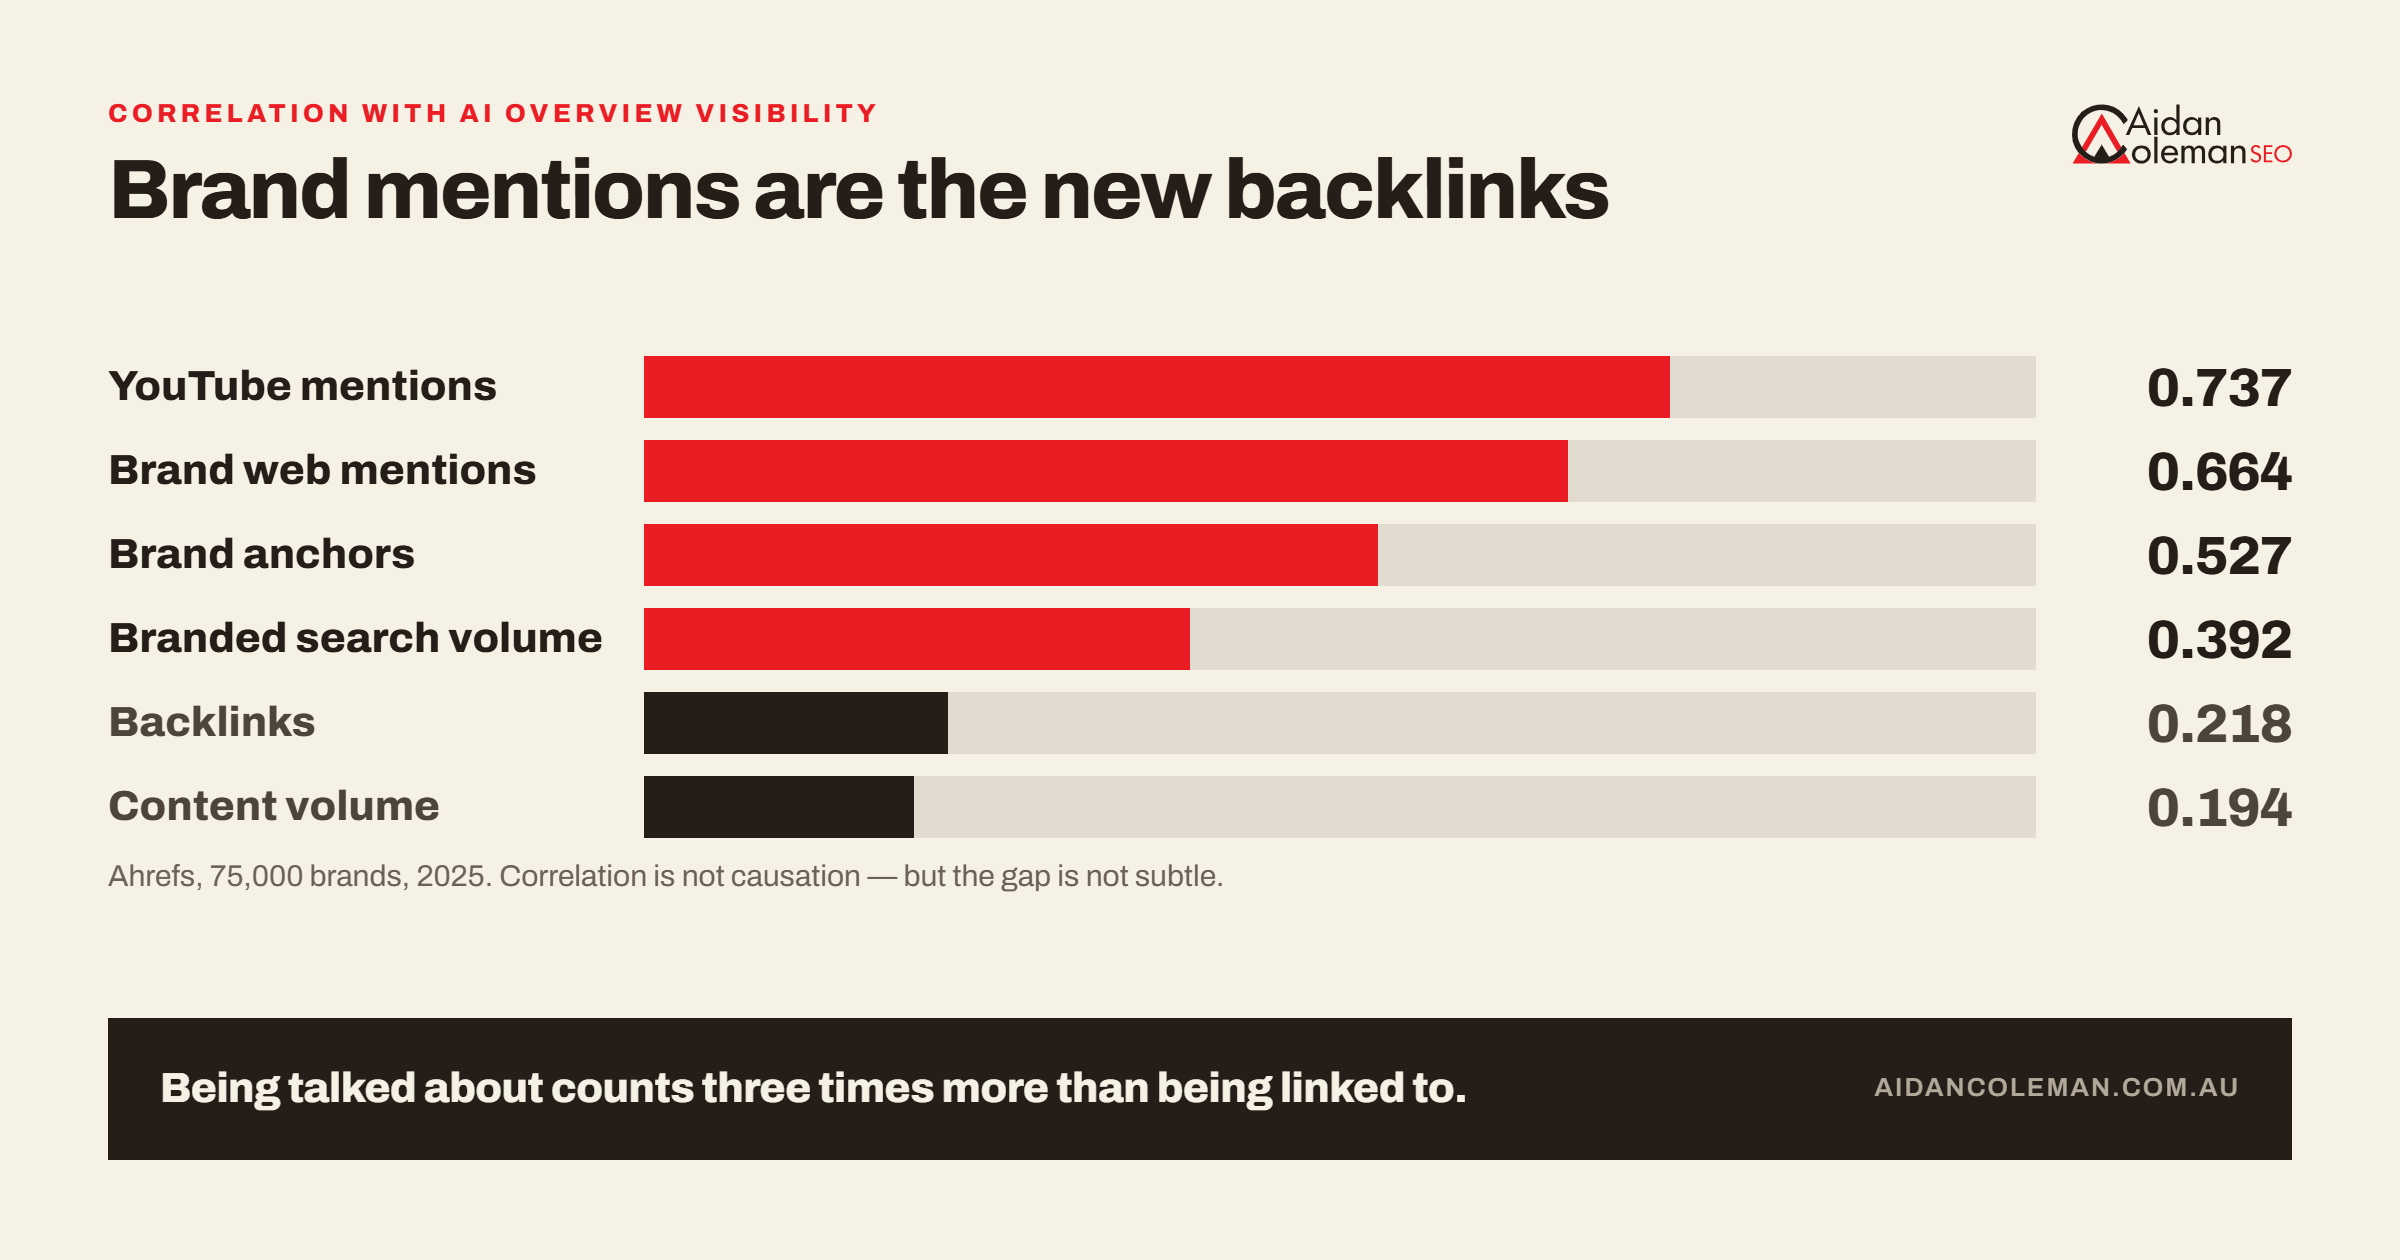
- Branded web mentions correlate with AI Overview visibility at 0.664. Backlinks correlate at 0.218. Ahrefs ran the correlations across 75,000 brands and found brand anchors at 0.527, branded search volume at 0.392 and sheer content volume at just 0.194.
- YouTube mentions were the strongest single signal at roughly 0.737. Correlation is not causation here, since brands that earn mentions also tend to invest in everything else. But it is why link building has to be thought about as brand building now.
- 45% of AI Overview citations change between generations of the same answer. Ask twice, get a different source list.
- AI Overviews and AI Mode cite the same URL only 13.7% of the time. Two features, two models, two completely different source sets.
- 44% of cited content comes from the first 30% of a page. Front-load the answer. Do not bury it under 400 words of preamble.
Australian AI Overview Statistics
Nearly every article on this topic runs on US data. Here is what we know about Australia specifically.
- AI Overviews launched in Australia on 29 October 2024, announced on Google’s Australian blog. AI Mode followed on 8 October 2025.
- Google holds 90.7% of Australian search, with Bing at 6.56% and DuckDuckGo under 1%, as of January 2026. Still dominant, but down from 93.67% in August 2024 as Copilot and Edge defaults push Bing up.
- 13.6 million Australians, or 58% of those aged 14 and over, use AI tools in an average four weeks. Roy Morgan asked 14,646 people between January and March 2026. ChatGPT leads at 10.5 million, Gemini 5 million, Copilot 4 million.
- Only 36% of Australians are willing to trust AI, against 46% globally, and 78% are concerned about negative outcomes. The University of Melbourne and KPMG put the question to 48,340 people across 47 countries.
- Nobody has publicly measured how often AI Overviews appear in Australian search results. Every prevalence figure in this article, including the ones above, comes from US or global samples. Some Australian agencies quote “55 to 57% of Australian searches” with no transparent dataset behind it. If you see that number, ask where it came from.
That last gap is worth sitting with. Australians use AI heavily and trust it less than almost anyone, which means most people are still checking your website, your reviews and your Google listing after the AI names you.
How to See AI Overviews in Google Search Console
Here is the part nobody explains properly.
The short version: there is no AI Overview filter
Google’s official documentation on AI features is unambiguous. Sites appearing in AI Overviews and AI Mode are counted inside overall search traffic and reported in the Performance report under the “Web” search type. There is no separate filter, and there never has been.
So when your impressions climb but clicks flatten, you cannot prove it was an AI Overview from Search Console alone. That is the honest position.
What the documentation does define:
- A click means someone clicked an external link in AI Mode
- An impression means your page appeared in the AI response
- Position follows the normal rules, with each component scored separately
- Follow-up questions count as brand new queries
The new AI performance reports
Google has since added dedicated generative AI performance reports, isolating impressions across AI Overviews, AI Mode and Discover, broken down by page, country, device and date.
Aidan covered the announcement on LinkedIn when it landed:
Massive SEO News: Google is launching the most requested report in Google Search Console ever. A new AI performance report.
Dedicated reports for both Search and Discover. In Search it reflects AI Overviews and AI Mode. The report focuses on impressions inside generative AI features rather than clicks, and it is rolling out to a subset of websites first.
The limitation worth knowing: you will not see actual user queries. Only impressions by page, country, device and date.
Read the full post on LinkedIn
That limitation is the whole story. Impressions without queries tells you that you appeared, not what you appeared for.
What you can do in the meantime
Use the AI-powered configuration in the Performance report. Google announced it on 4 December 2025. You describe the analysis in plain English and it builds the filters and regex for you. It only works on the Search results report, and it cannot sort or export, but for slicing query sets it saves real time.
Filter for long queries with regex. AI Overviews skew heavily toward longer, question-shaped searches, and only 8% of one or two-word searches trigger one. Filtering queries of ten or more words gives you a rough proxy for your most AI-exposed traffic.
Watch the impressions-to-clicks gap. Rising impressions with flat clicks on informational pages is the signature pattern. It is not proof, but it is a signal worth tracking monthly.
Cross-check in Bing Webmaster Tools. Bing shipped an AI Performance report that tracks citations in Copilot and its own AI summaries. It is a different engine, but it is currently the cleanest first-party AI citation data anyone offers.
Use a dedicated tracker for citations. Ahrefs Brand Radar, Semrush’s AI toolkit, Profound, Peec AI and Otterly all monitor whether your domain gets cited across AI surfaces. This is the layer Search Console does not cover, and it is the one I lean on when measuring AI performance for clients.
How to Check Gemini and AI Mode SERP Features
Four practical methods.
1. Turn AI Overviews off with udm=14
Add &udm=14 to the end of a Google search URL and you get the classic web results with no AI Overview. Comparing the two views side by side shows you exactly what the AI block is pushing down.
To make it permanent, add a custom search engine in Chrome pointing at https://www.google.com/search?q=%s&udm=14.
One caveat: the Web filter itself is documented, but the parameter is not. It could stop working without notice, and it is not an official opt-out.
2. Go straight to AI Mode
google.com/ai opens AI Mode directly. Run your key commercial queries there and check the source panel to see which sites it pulled from.
Because AI Mode and AI Overviews only cite the same URL 13.7% of the time, checking one genuinely does not tell you about the other. Check both.
3. Force Australian results
Add &gl=au&hl=en to a search URL to see results as an Australian user. Useful if you are travelling, using a VPN, or checking what a Brisbane customer sees while you sit in Sydney.
Results will still vary by personalisation, login state, Search Labs settings and device, so test in an incognito window and on a phone as well as desktop.
4. Check your own citations
Manually, open the AI Overview, expand the source list and look for your domain. Do it across ten or fifteen of your money queries and you have a baseline.
At scale, the tracking tools above do it across hundreds of prompts and log changes over time. Given that 45% of citations change between generations, a single screenshot proves nothing. You need the trend.
Four AI Overview Statistics You Should Stop Repeating
“60% of searches show an AI Overview.” No transparent all-query dataset supports this. The defensible range is 20% to 50%, and roughly half of searches still show none.
“55 to 57% of Australian searches show an AI Overview.” Untraceable. Nobody has published an Australian prevalence dataset. If an agency quotes this, ask for the methodology.
“AI Overviews only ever reduce clicks.” Click-through rate bottomed out in December 2025 and rebounded 85% in the following two months. The straight-line collapse narrative is a year out of date.
“Rank number one and you will be cited.” Surfer found 67.82% of citations do not rank in the top 10 for the query or its fan-outs, and Moz found 88% of AI Mode citations do not appear in the organic results at all.
What to Actually Do With This
Work out your exposure before anything else. Healthcare at 88% and e-commerce at 4% are not the same problem. Check your industry, then check your query mix. If your money pages are transactional, your exposure is around 5%.
Protect the informational content, defend the transactional. Informational queries are seven times more exposed. That is where to focus structure, clarity and front-loaded answers.
Front-load every answer. 44% of cited content comes from the first 30% of a page.
Build mentions, not just links. A 0.664 correlation against 0.218 is not a subtle difference.
Do not check only one surface. AI Overviews and AI Mode agree on a cited URL 13.7% of the time.
Keep the local fundamentals strong. Transactional and near-me booking queries are still largely AI-free, which means local SEO and your Google Business Profile are doing the heavy lifting on the searches that actually produce jobs.
Keep it in proportion. Roughly half of searches show no AI Overview at all, and traditional SEO still pays the bills. The AI layer sits on top of the fundamentals.
Methodology
Every statistic here names its source, sample size and date, and links to the original study wherever a verified URL exists. Nothing is sourced from another roundup.
Prevalence figures are not comparable across vendors. Each measures a different keyword set, geography, device mix and detection method, which is why they range from 18% to 50%. They are presented side by side rather than averaged, because averaging them would produce a number that describes nothing.
Where a commonly quoted figure could not be traced to a primary source, it is flagged as unmeasured rather than repeated. This includes all Australian AI Overview prevalence claims.
Figures are current as at publication and this page is updated as the major studies refresh.
If you cite or reproduce this data, please link back to this page.