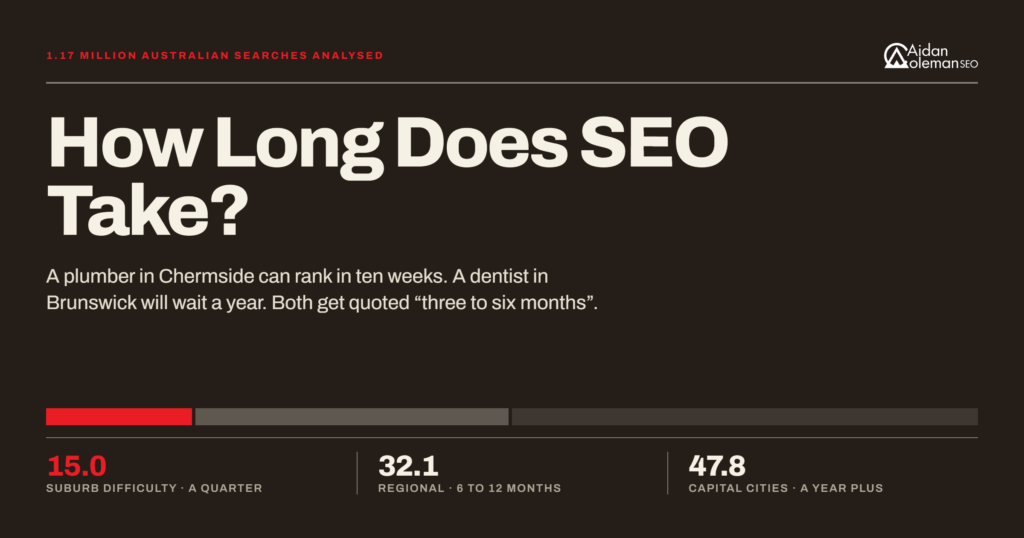
A plumber in Chermside can rank in ten weeks. A dentist in Brunswick will wait a year for the same result.
Both of them get quoted “three to six months.”
That number is an average of two businesses running completely different races, which is why so many owners feel lied to by month five. So I stopped repeating the average and measured the spread instead.
So I pulled Ahrefs difficulty, volume and cost-per-click data across 15 Australian industries representing 1.17 million searches a year, covering every mainland capital, their suburbs and the major regional centres.
Here is how long SEO actually takes, by industry, and the single number that predicts your timeline before you spend a dollar.
Key Takeaways
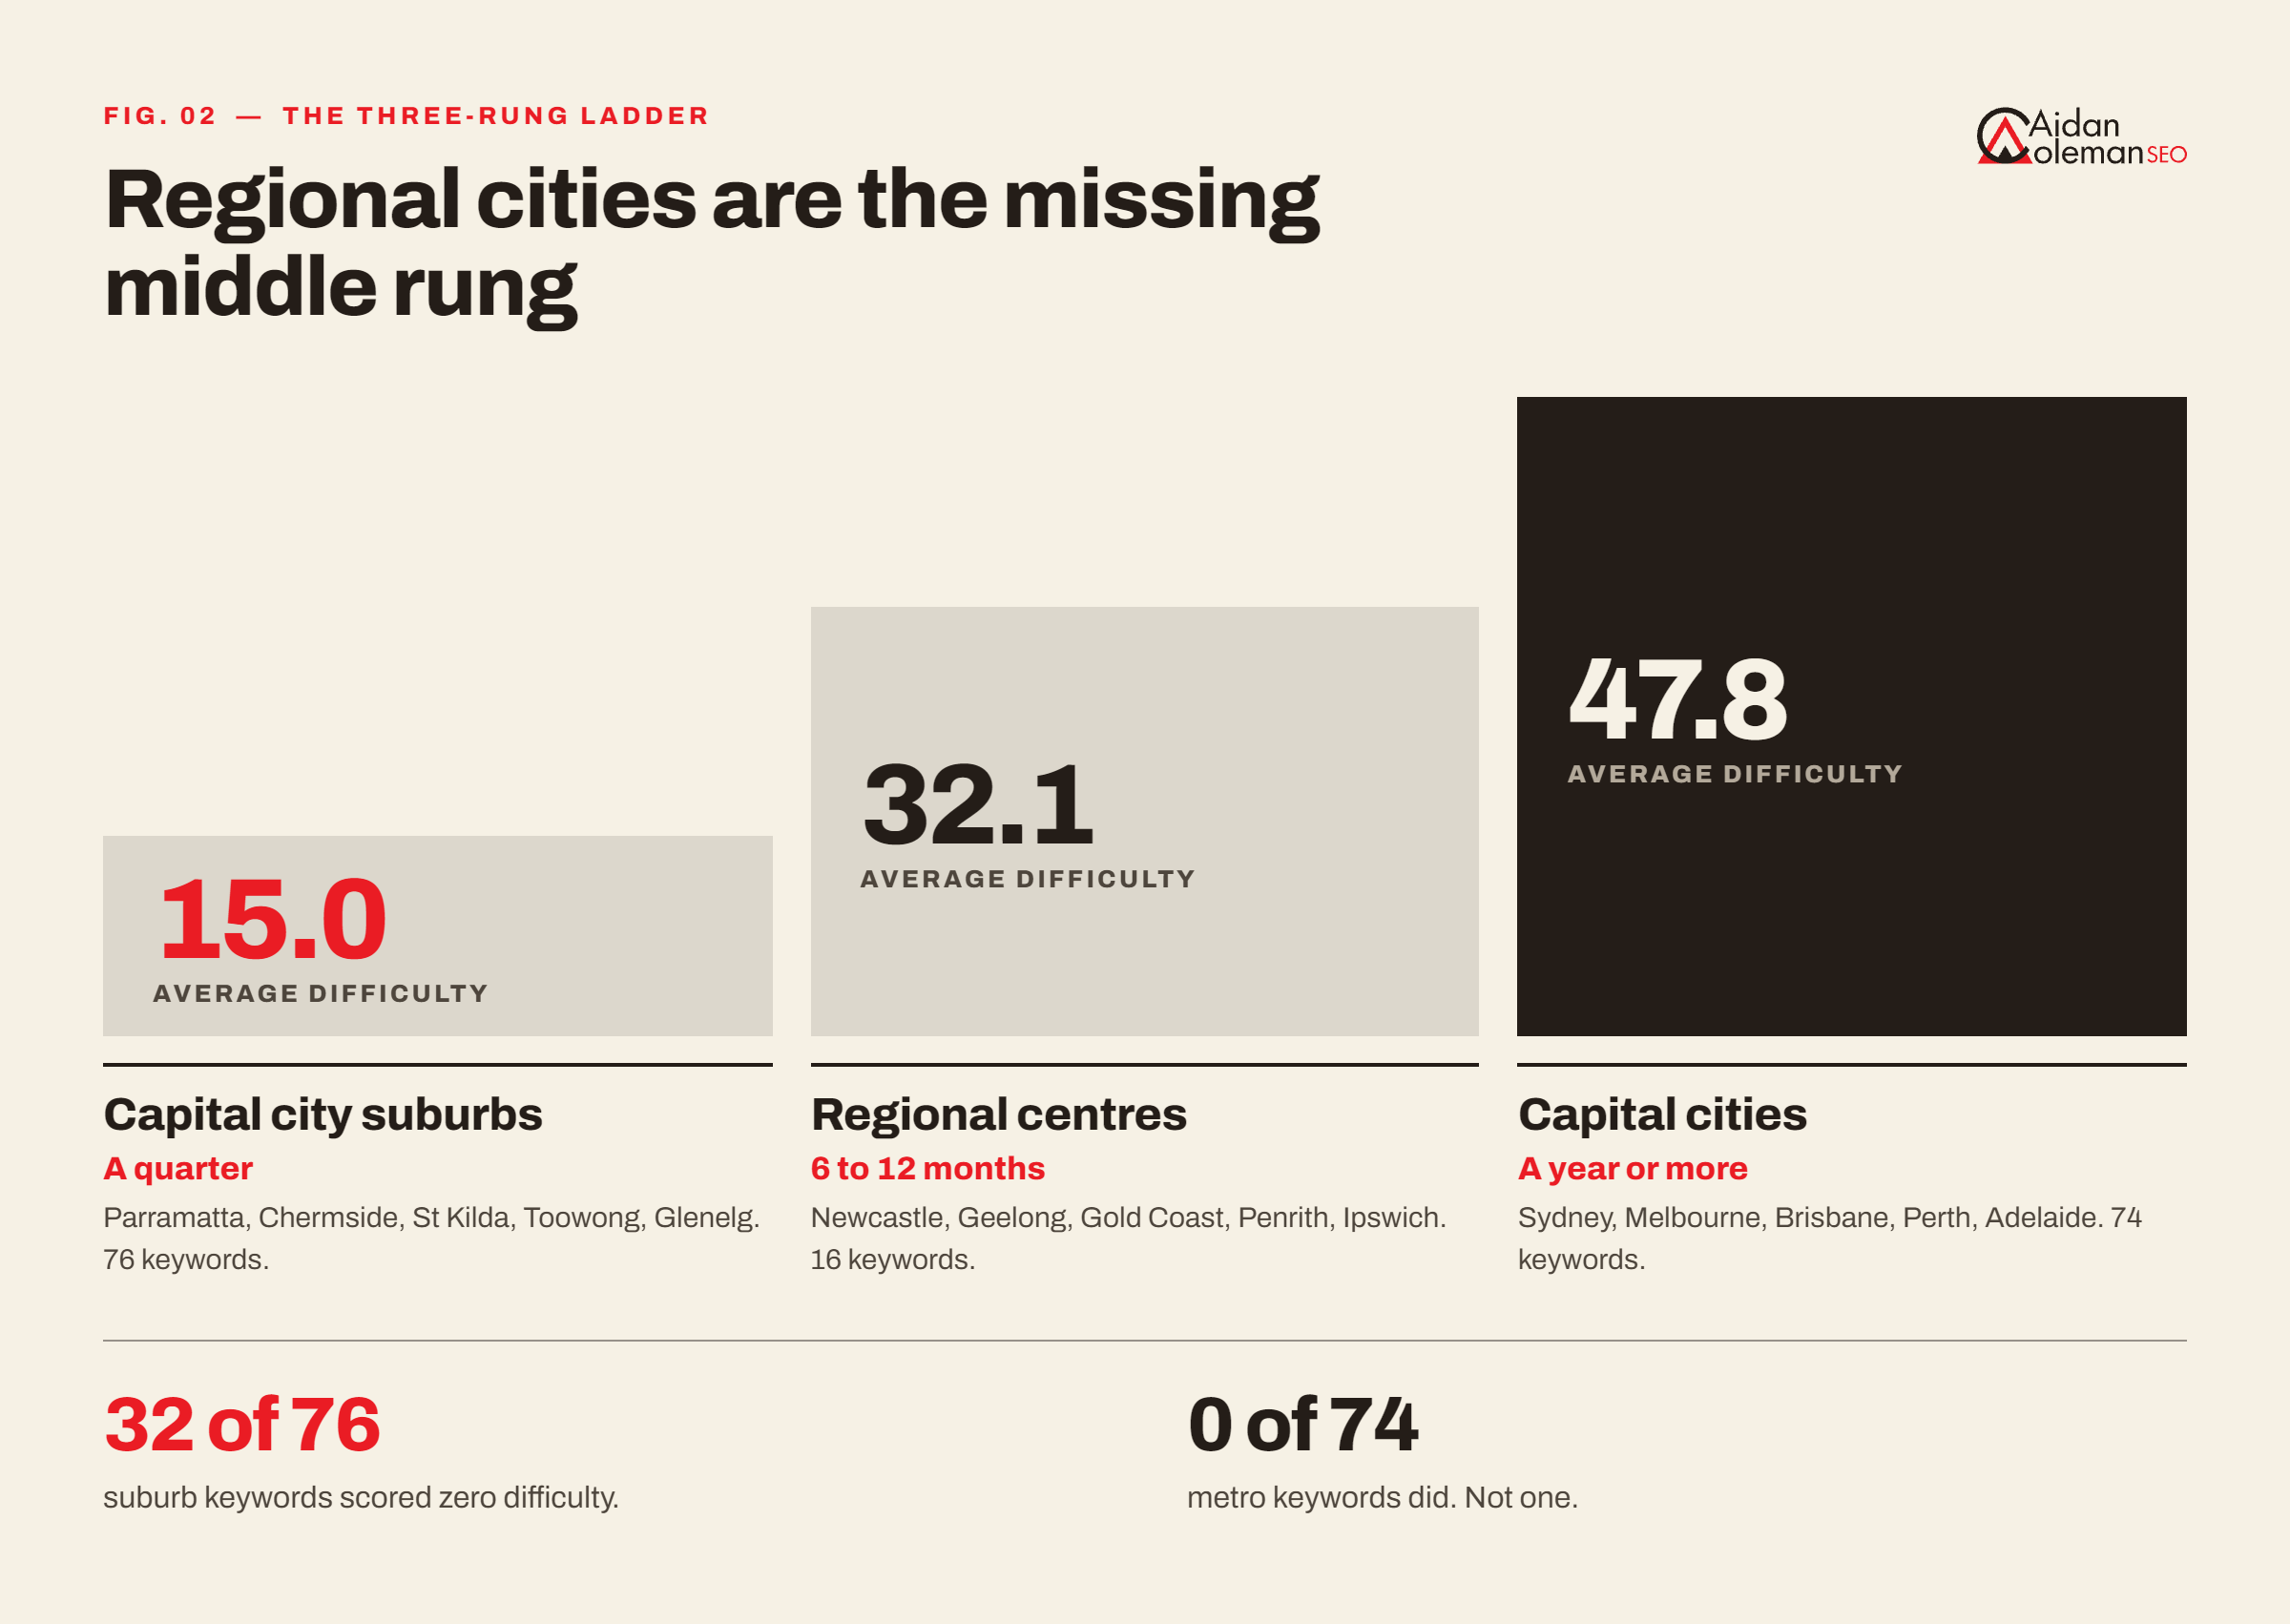
- Across 1.17 million annual searches, capital city keywords averaged a difficulty of 47.8. Their suburb equivalents averaged 15.0. Not one of the 74 metro keywords scored zero difficulty. Forty-two percent of the suburb keywords did.
- Tradies escape. Professionals do not. Every trade in the study fell below difficulty 16 at suburb level. Dentists, physios, accountants and family lawyers all stayed above 30.
- Regional cities are the missing middle rung. Newcastle, Geelong and similar centres averaged 32.1, sitting neatly between the capitals and the suburbs.
- The easier keyword usually costs more per click. Suburb terms carried a higher CPC than their metro equivalents in 11 of 15 industries.
- Your city matters more than your trade. Plumber Brisbane sits at difficulty 11. Plumber Melbourne sits at 70.
Why “Three to Six Months” Fails Almost Everyone
The standard answer is not wrong so much as useless.
Google’s own guidance on hiring an SEO says most SEOs need four months to a year to make improvements and for a business to start seeing the benefit. That is a nine-month window, deliberately wide because Google knows the variables swing hard.
The variable that swings hardest is the one nobody checks: how contested your specific keywords already are.
Ahrefs put the scale of the problem in perspective when it re-ran its ranking study across a million pages in May 2025. Only 1.74% of newly published pages reached the top 10 within a year, down from 5.7% in 2017, and the average page sitting at number one is now five years old.
But buried in the same study is the number that should change how you judge progress: of the pages that did reach the top 10, 40.82% got there within the first month.
Ranking is not a slow, even climb. Pages either find traction early or they sit still. Six months of nothing is not a sign to be patient. It is a sign you picked a keyword you cannot currently win.
So which keywords can you win? That depends almost entirely on your industry.
Keyword Difficulty Is Just a Link Count in Disguise
Quick bit of plumbing before the results, because it makes everything else click.
Ahrefs builds its difficulty score from one input: how many websites link to the pages currently in the top 10. It explains the method in its own breakdown of the metric, and publishes rough conversions. A difficulty 40 keyword needs somewhere around 56 referring domains. A difficulty 60 keyword needs closer to 249.
Links take months to earn and cannot be safely bought in bulk.
So difficulty is not an abstract score. It is a link count, and a link count is a calendar. That is why your timeline is knowable in advance, and why any quote given before someone opens a keyword tool is guesswork.
The 15 Industries, From Slowest to Fastest
Metro difficulty is the average across Sydney, Melbourne, Brisbane, Perth and Adelaide. Suburb difficulty is the average of suburb-level terms in that industry. Sample sizes are shown so you can weigh each figure. Timeline bands are my read on what those link requirements mean in practice.
| Industry | Metro KD | Metro timeline | Suburb KD | Suburb timeline |
|---|---|---|---|---|
| Landscapers | 64.4 (n=5) | 12 to 18 months | 15.2 (n=5) | 3 to 6 months |
| Chiropractors | 58.4 (n=5) | 12 to 18 months | 19.9 (n=8) | 3 to 6 months |
| Roofers | 58.2 (n=5) | 12 to 18 months | 12.0 (n=3) | 3 to 6 months |
| Dentists | 57.4 (n=5) | 12 to 18 months | 46.0 (n=5) | 6 to 12 months |
| Family lawyers | 56.3 (n=6) | 12 to 18 months | 32.0 (n=2) | 6 to 12 months |
| Physiotherapy | 55.2 (n=5) | 12 to 18 months | 39.8 (n=5) | 6 to 12 months |
| Pest control | 52.2 (n=5) | 12 to 18 months | 1.0 (n=8) | 6 to 12 weeks |
| Plumbers | 51.0 (n=5) | 12 to 18 months | 0.0 (n=5) | 6 to 12 weeks |
| Accountants | 47.0 (n=5) | 6 to 12 months | 39.0 (n=5) | 6 to 12 months |
| Real estate agents | 44.3 (n=3) | 6 to 12 months | 10.0 (n=3) | 6 to 12 weeks |
| Removalists | 43.2 (n=5) | 6 to 12 months | 3.4 (n=8) | 6 to 12 weeks |
| Painters | 39.4 (n=5) | 6 to 12 months | 8.2 (n=5) | 6 to 12 weeks |
| Electricians | 34.2 (n=5) | 6 to 12 months | 0.0 (n=5) | 6 to 12 weeks |
| Concreters | 32.6 (n=5) | 6 to 12 months | 14.5 (n=2) | 3 to 6 months |
| Mechanics | 20.2 (n=5) | 3 to 6 months | 6.3 (n=7) | 6 to 12 weeks |
Find your row. That is your honest starting point, and there is a fifteen-month spread between the top of the table and the bottom.
Why Tradies Escape and Professionals Don’t
Read those last two columns together and one pattern eats everything else.
Every single trade fell below difficulty 16 at suburb level. Plumbers and electricians collapsed to zero. Pest control landed on 1. Removalists on 3.4. Painters on 8.2.
Not one of the health or finance professions managed it. Dentists only fell from 57.4 to 46. Physios from 55.2 to 39.8. Accountants barely moved at all, from 47 to 39.
Individual results are starker. Dentist Brunswick came back at difficulty 64, harder than dentist Melbourne at 58. Physio Subiaco came back at 57, basically identical to physio Perth. Accountant Bondi came back at 43 on ten searches a month. Going suburb-level bought those businesses nothing.
The reason sits in the link economy. A suburban plumber’s page-one rivals are other plumbers with thin sites and almost no backlinks, so the bar is on the floor. A suburban dentist competes with health directories, booking platforms, insurer pages and university-affiliated practices, all of which drag real backlink profiles into every suburb search. Accountants face the same thing from professional bodies and finance publishers.
Chiropractors are the interesting middle case at 19.9, closer to the trades than to the clinics, because chiropractic sits outside most of the medical directory ecosystem.
If you run a clinic or a professional practice, plan for 6 to 12 months even locally, and accept that links are not optional. If you are a tradie, suburb-level local SEO is close to the fastest marketing channel you have access to.
The Missing Middle: Regional Cities
Something I did not expect until I widened the sample.
Regional centres like Newcastle, Geelong, Penrith and Ipswich averaged difficulty 32.1, sitting neatly between the capitals at 47.8 and the capital-city suburbs at 15.0.
That gives you a three-rung ladder rather than a binary choice:
- Capital city terms: 47.8 average. A year or more.
- Regional city terms: 32.1 average. Six to twelve months.
- Capital city suburb terms: 15.0 average. A quarter.
Removalists Newcastle sits at 43 while removalists Parramatta sits at 0, despite Newcastle having more than double the search volume. Regional businesses often assume they have it easier than the big smoke. On this data they are competing much closer to capital city difficulty than to suburb difficulty, because they are the only game in a well-defined market and the incumbents have had years to build authority.
The Easy Keyword Is the One Advertisers Pay Most For
I expected suburb keywords to be cheap. Smaller audience, less commercial weight, cheaper clicks.
Wrong. Across the full dataset, suburb keywords averaged $3.82 a click against $3.31 for capital city terms, and carried a higher CPC in 11 of the 15 industries.
The individual pairs are more dramatic:
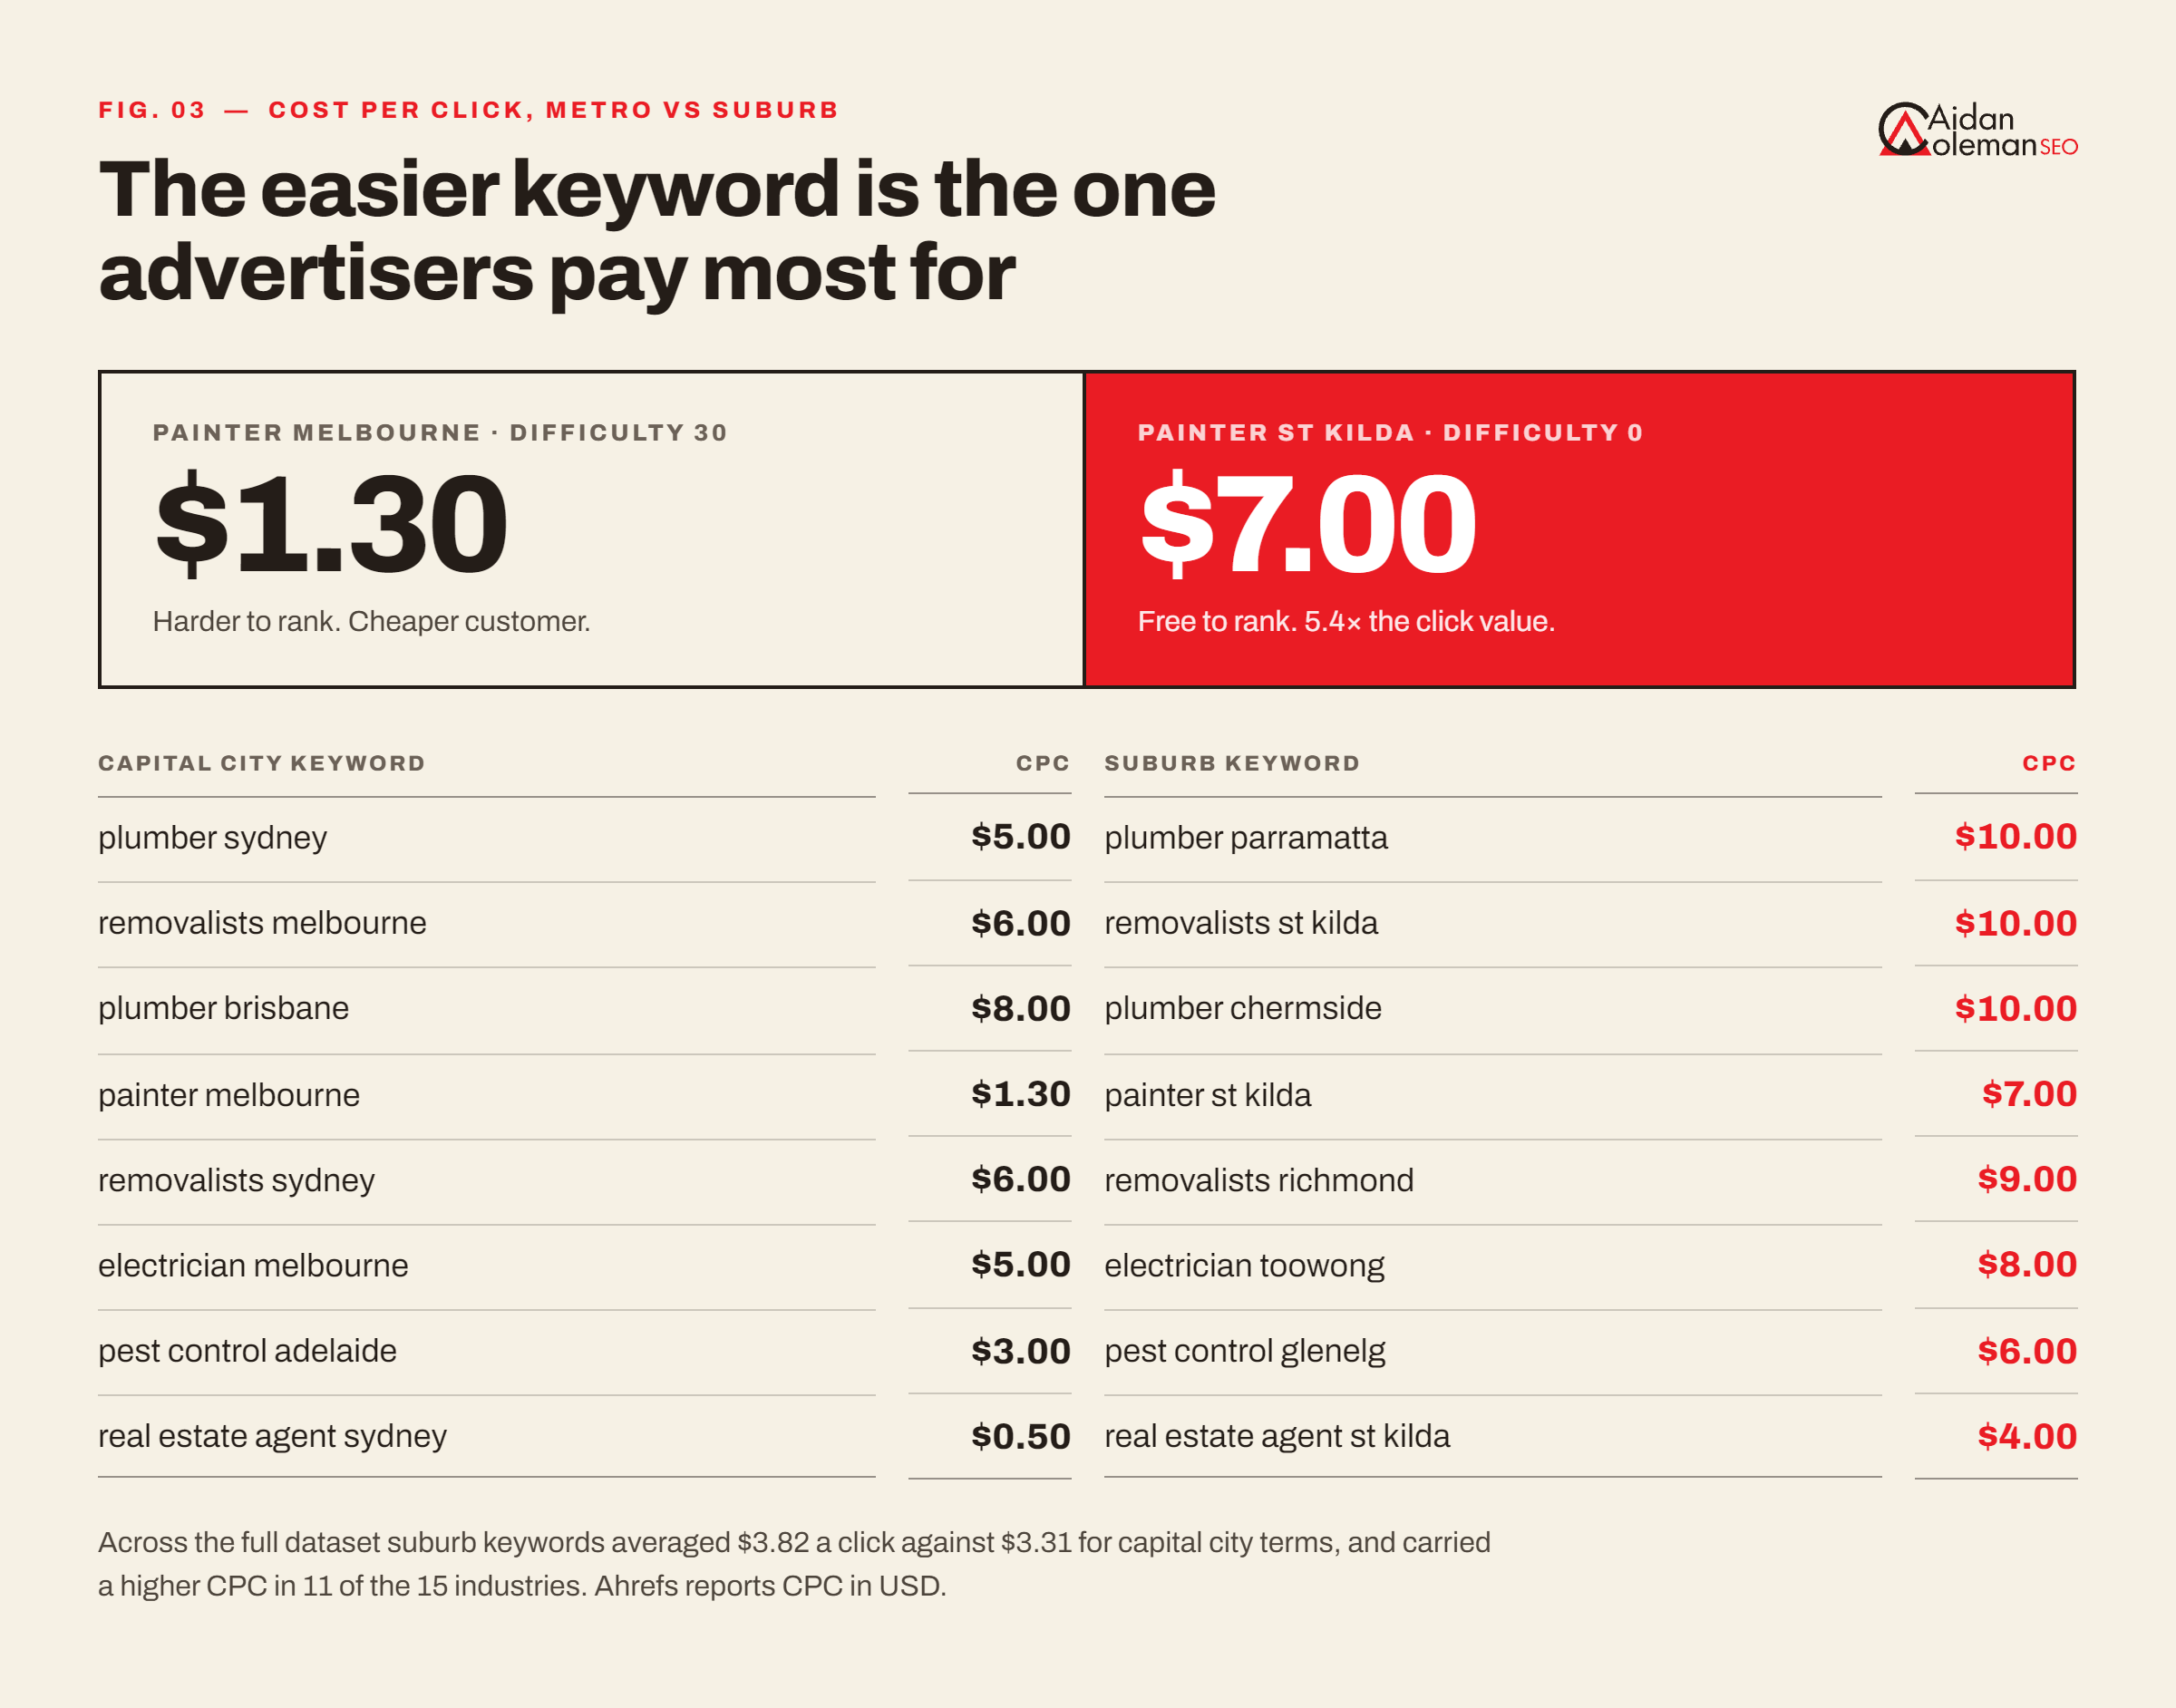
Cost per click is the market pricing a customer. Advertisers bid what a job is worth to them, and they are bidding more on the terms that are far easier to rank for organically.
Painter St Kilda is a zero-difficulty keyword worth $7.00 a click. Painter Melbourne is a difficulty 30 keyword worth $1.30. Most painters in Melbourne are chasing the harder keyword to win the cheaper customer.
That is the whole game, and it is why the fastest option is usually also the most profitable one.
Your City Matters More Than Your Trade
I assumed the capitals would cluster, with Sydney hardest and the smaller cities easier. They do not cluster at all.
Plumber Brisbane sits at difficulty 11. Plumber Melbourne sits at 70. Same trade, similar search volume, 59 points apart. Mechanic Melbourne is a 2 while mechanic Brisbane is a 45. Family lawyer Adelaide is a 13 while family lawyer Sydney is a 69.
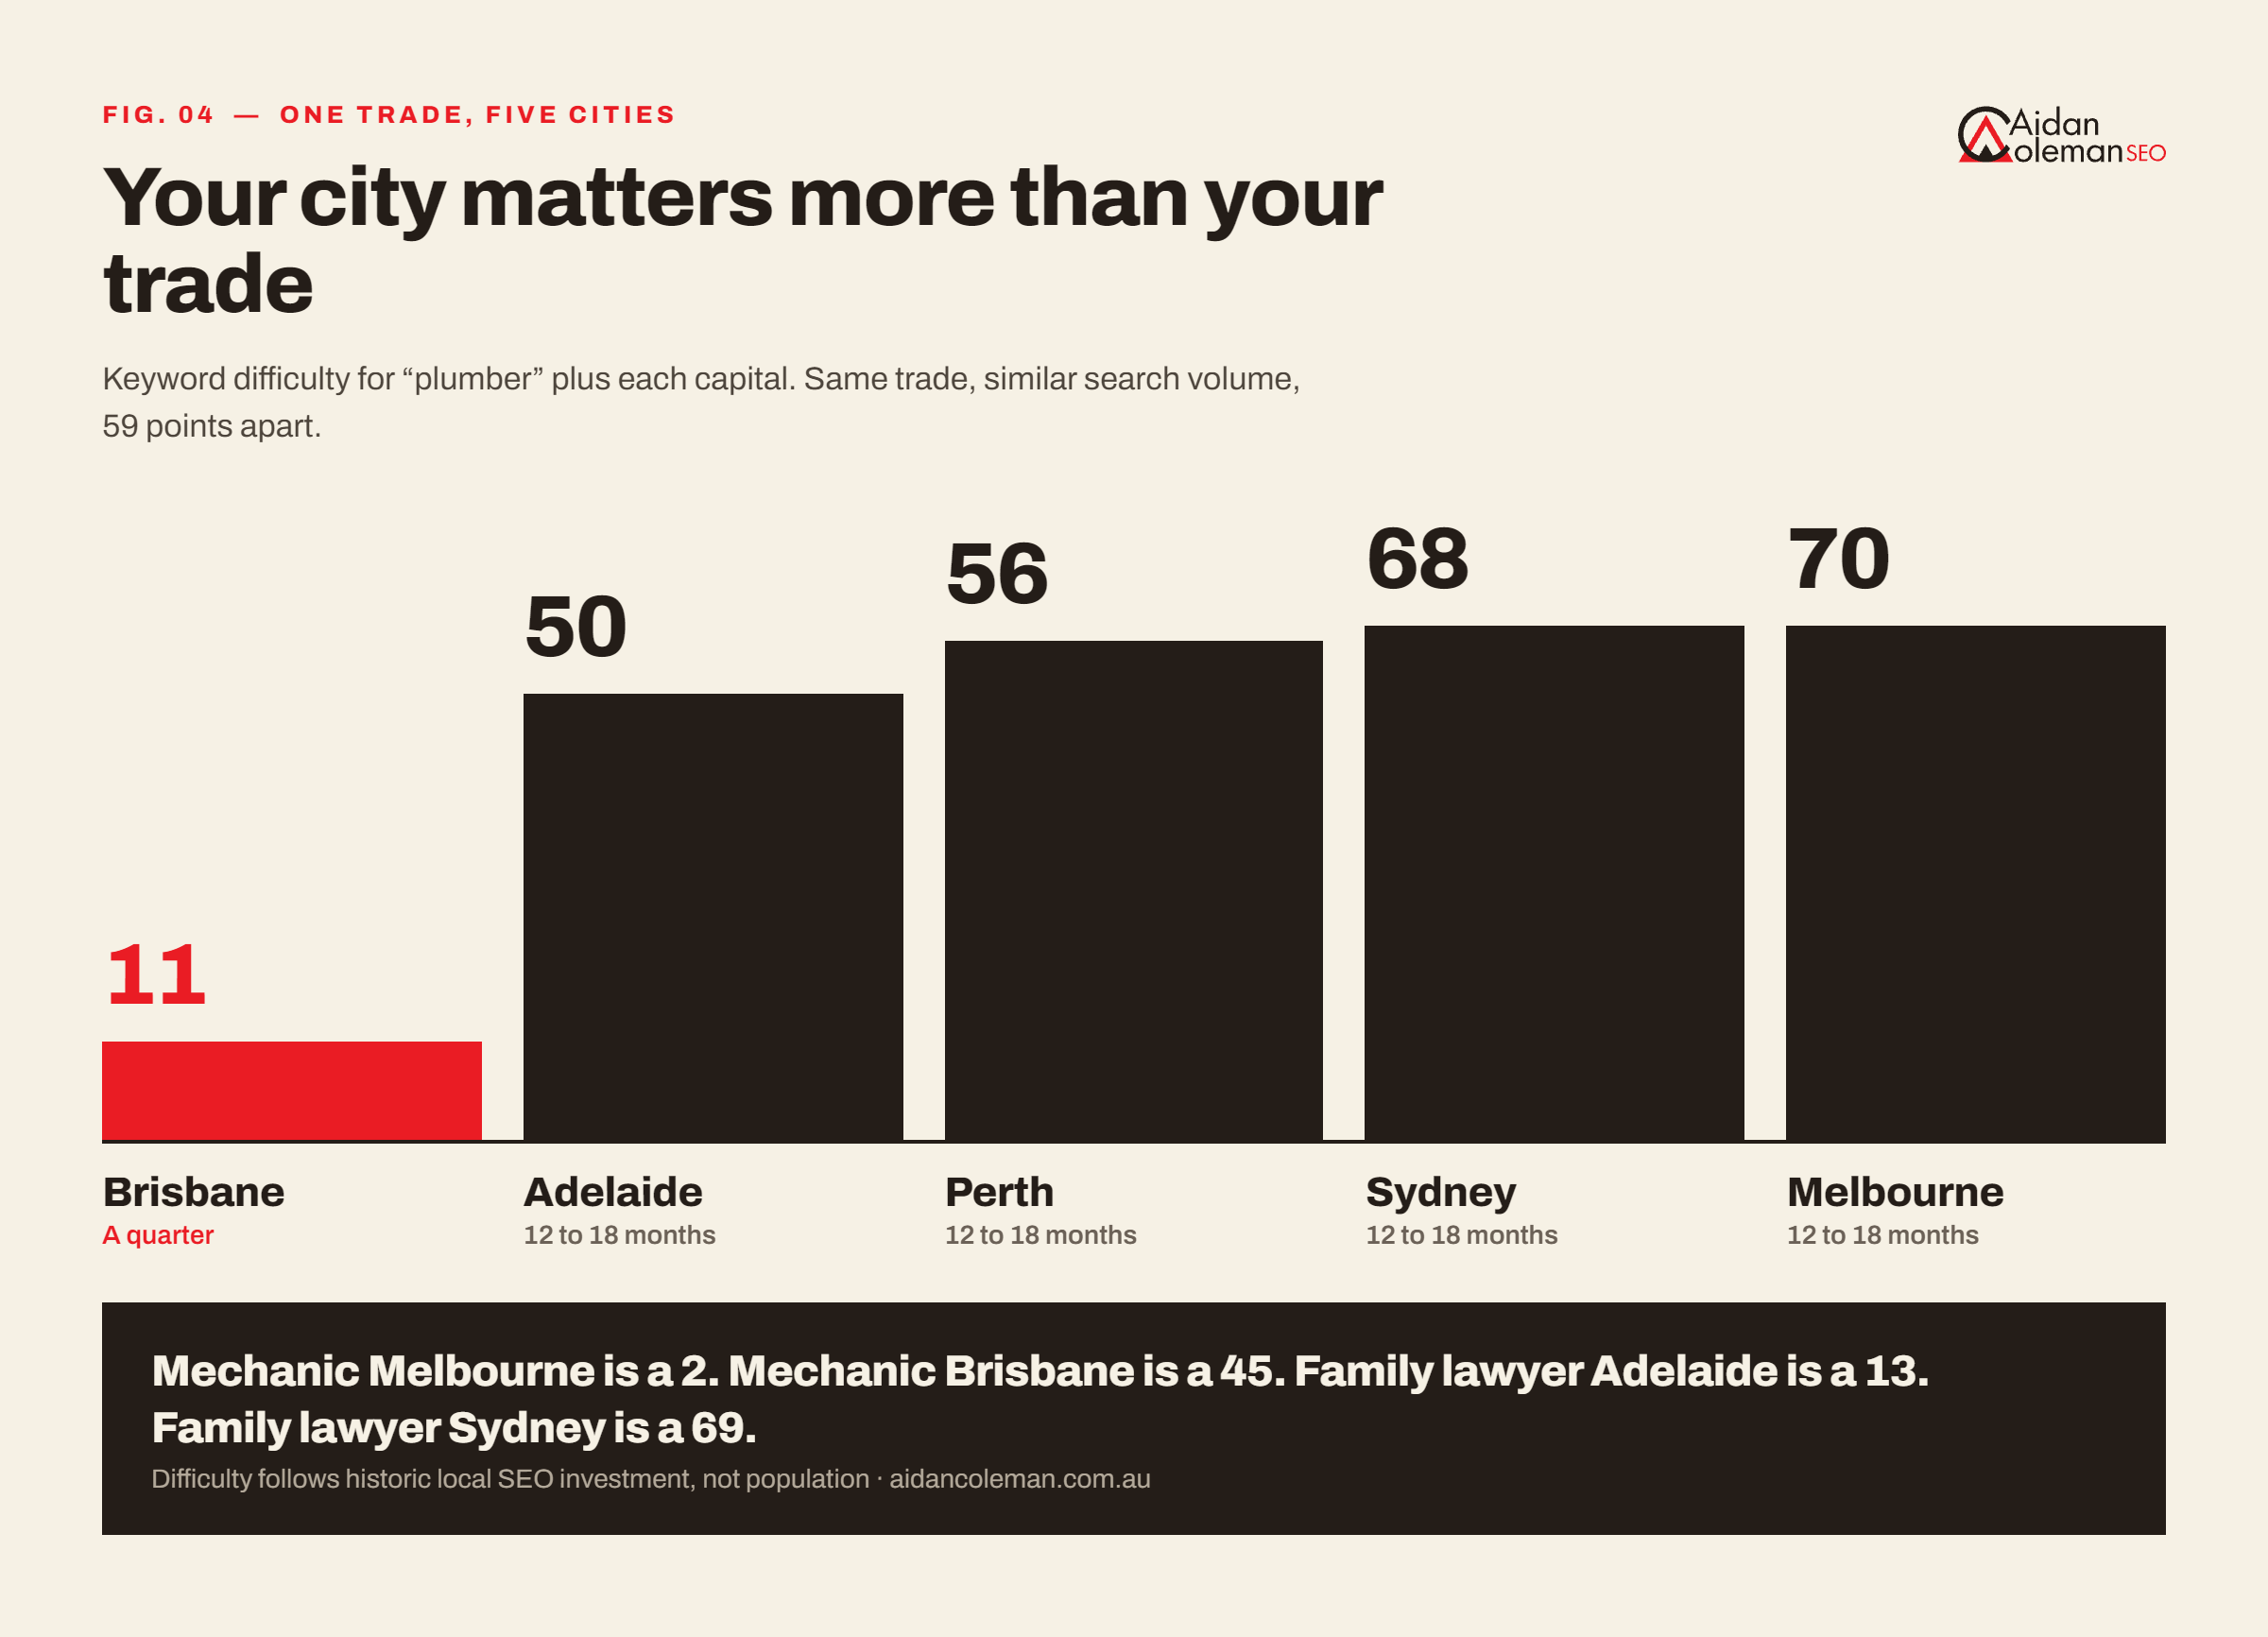
What actually sets difficulty is whether businesses in that specific city and category have historically invested in SEO. That varies enormously and it does not follow population.
Which is why national timeline advice is close to worthless. SEO in Brisbane for a plumber and SEO in Sydney for a family lawyer are not the same project and should never carry the same schedule.
What Actually Happens in Your First Twelve Months
Months 1 to 3. Technical fixes, Search Console and GA4 set up properly, keyword mapping, on-page work. Impressions start climbing and pages sitting at positions 11 to 20 get nudged onto page one. If your targets are zero-difficulty suburb terms with a solid Google Business Profile behind them, this is when they land.
Months 4 to 6. Low-difficulty keywords reach page one and the first organic enquiries arrive. This is where most owners either commit or quit, and quitting here means paying for the foundations and leaving before the return.
Months 7 to 12. Content and links compound. Keywords in the 30 to 50 range become winnable, which is where the regional city terms and the professional-services suburb terms live. New pages rank faster than your old ones did.
Month 12 and beyond. The 50-plus metro terms finally come into range. Not before, and anyone selling you otherwise has not counted the link gap.
Why Most Sites Never Reach Page One At All
Semrush tracked 28,000 new domains for 13 months and found something that lines up exactly with the difficulty data: 55.1% of the domains that never made page one had no backlinks whatsoever.
Not weak links. None.
The same study found 41% of new domains reached the top 10 within six months, but only 4.2% held a top-10 position for the full 13 months. Getting there is achievable. Staying is what almost nobody manages.
This is the most common reason an Australian campaign stalls. Content gets written, technical issues get fixed, the profile gets optimised, and then everything above difficulty 40 refuses to budge because the site has no authority behind it.
On zero-difficulty suburb terms you can rank without links. Above 40 you cannot, because the score is literally a measure of the links you do not have yet.
Ranking Is No Longer the Same as Getting the Click
One complication worth knowing before you set expectations.
Ahrefs analysed 300,000 keywords and found position-one click-through rate drops 58% when an AI Overview appears, up from the 34.5% it measured in early 2025. Seer Interactive, working across 42 organisations and 25 million impressions, put the decline at 61% and found that pages cited inside the AI Overview earned 35% more clicks than those left out.
Pew Research, tracking nearly 69,000 real searches, found people clicked a normal result 8% of the time with an AI Overview present versus 15% without.
The good news for local businesses is that commercial searches like “plumber Parramatta” trigger AI Overviews far less often than informational ones. You are less exposed than a publisher. But AI visibility is becoming its own timeline and needs measuring separately.
Anyone Promising Number One in 30 Days
Nobody can guarantee rankings. The Semrush figure makes the case better than any argument I could write: only 4.2% of sites held a single top-10 position for 13 straight months. Guaranteeing a fixed position means guaranteeing something 95.8% of websites failed to do.
Under Australian Consumer Law a business has to be able to substantiate what it advertises, and the ACCC is clear on that.
Walk away from guaranteed rankings, anyone hinting at a special relationship with Google, and any timeline quoted before someone has checked the difficulty of your actual keywords. That last one is the real tell.
Work Out Your Own Timeline in Ten Minutes
- Get the difficulty of the five keywords you actually want. Not the volume, the difficulty.
- Check the cost per click on each. If the easier term costs more, as it did in 11 of the 15 industries here, start there.
- Make sure the suburb has volume. Landscaping Chermside and concreter Parramatta returned almost nothing, and winning nothing is still nothing.
- Count your referring domains against what the target needs. A difficulty 40 keyword wants roughly 56.
- Apply the bands. Under 10 is a quarter. 11 to 30 is 3 to 6 months. 31 to 50 is 6 to 12. Above 50 is a year and a half with links behind it.
My free SEO cost calculator will tell you roughly what that level of work costs.
Methodology
All figures were pulled from Ahrefs Keywords Explorer, Australian database, August 2026. 173 keywords across 15 industries, together representing 97,500 searches a month or 1.17 million a year. 166 returned complete difficulty data and 7 had insufficient volume to score.
Keywords were grouped into three tiers. Metro covers Sydney, Melbourne, Brisbane, Perth and Adelaide (n=74). Suburb covers capital city suburbs including Parramatta, Bondi, St Kilda, Richmond, Chermside, Toowong, Fremantle, Joondalup, Norwood, Glenelg, Penrith, Frankston and Ipswich (n=76). Regional covers separate centres including Newcastle, Geelong and the Gold Coast (n=16). Combined volume across all terms is 97,500 searches a month.
Ahrefs difficulty is a logarithmic 0 to 100 score based on referring domains to the current top 10. It does not measure content quality or search intent. Ahrefs reports CPC in USD. Timeline bands are my own interpretation of what those link requirements mean in practice, not an Ahrefs output.
If you cite these tables, please link back to this page.